WorldStox Stock Charts & Breakout Alerts app for iPhone and iPad
Developer: WorldStox LLC
First release : 02 Nov 2015
App size: 62.92 Mb
WorldStox Charts & Alerts - an "Early Warning System" for the stocks you are watching. When prices abruptly break out from the most recent trend channels, you get sent an alert.
* Create a list of stocks, enable it for alerts via a checkbox, and get notifications whenever a trend-channel "breakout" event occurs.
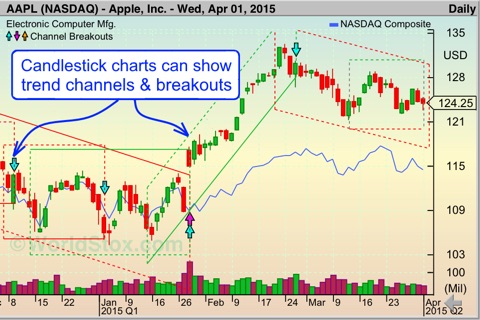
* Our regression technology identifies the current trend of the price action. These trend channels are visible as overlays on the charts.
* Breakout alerts warn you of possible impending trend changes from the current trend (displaying up, down, or sideways price action)
* Tapping a notification enables you to view the chart immediately.
* Full-screen colorful candlestick charts feature visual trend channels overlaying the price action. Trend channels make it easier to visualize price action direction.
* Thousands of stocks and funds trading worldwide in over 40 countries are at your fingertips!
Note: The FREE version offers optional upgrades to auto-renewable PREMIUM subscriptions of 1-month or 1-year, for $5.99 per month, or $59.99 per year. PREMIUM provides access to unlimited stock charts and watch lists.
See full "Subscriptions Terms" at the link below:
http://www.worldstox.com/subscription-terms/
Subscription terms include (1) "payment is charged to your iTunes Account", and (2) "subscription automatically renews unless auto-renew is turned off at least 24-hours before the end of the current period".
The Charts:
---------------
* The WorldStox app is intuitive and easy to use. All screens are in full screen landscape mode.
* All charts are "candlestick" charts. Invented by Japanese rice futures traders, these charts yield more intuitive visual information about price action and have enjoyed widespread adoption.
* The free version provides 15-minute delayed quotes during market trading hours. The premium edition provides real-time prices and after-hour quotes where available.
* Popular stock indexes for exchanges around the world are featured in our Market Index chart lists.
Chart Lists:
--------------
* Ticker symbols are stored in chart lists. A single list named "My Chart List" is in the free version; you may create unlimited lists in the premium version.
* Search by tickers or keywords to add stocks to your lists, or paste and import your tickers to create them quickly.
* When stock tickers change or company names change, these are automatically reflected in your chart lists.
* iCloud support allows you to share your chart lists across all your devices.
Navigation:
--------------
* The "Chart-Viewer" makes it very easy to navigate through full-screen charts. Swipe charts up or down, left or right. Tap edges of the charts to advance or return to another stock.
* Tap a chart to toggle views of the two trend analysis techniques. Tap the top of any chart to view the most recent price quote.
* Zoom in to enlarge any chart with double taps; return to normal view the same way.
Trend Analytics:
--------------------
* Regression trend channels and simple moving averages are the two featured analytic methods displayed to identify price trends and trend changes.
* "Trend-Finder" is our technology which objectively finds & displays the best trends that fit the past and present price action.
* The trend channels are overlays to help you clearly visualize the trend direction of the price action, be it up, down, or sideways.
* "Breakout" events alert you that something may be happening to end the trend and change the price direction. These give you an opportunity to respond sooner.
* Crossovers of a pair of simple moving averages may indicate a change in trend. This legacy method for tracking trends has stood the test of time.


